Where Does All the Money Go?
I was speaking on a panel about intercountry adoption recently at a conference, and during the Q&A time an adoptive mom in the audience asked, “where does all the money go?”
She was wondering in particular about how much money adoption agencies make, and the compensation of personnel. She had heard that “there’s no money in intercountry adoption” but she was skeptical. Her skepticism is understandable, since, in her words: “I spend forty thousand dollars…where did it all go?”
To answer this question, we viewed the IRS Form 990 (tax return) of every Hague-accredited adoption agency for which the form was available. These forms are public record, and can be viewed on several charity tracking sites, such as www.guidestar.org. Below are some observations and answers to the question, “Where does all the money go?”
The “Industry” (Gross Revenue)
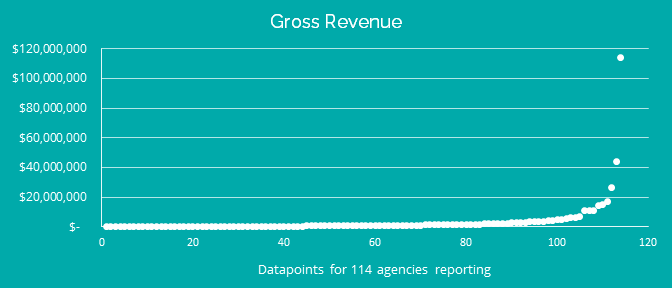
It is often said in books, news programs, and websites that international adoption is a multi-billion dollar industry. However, according to the Hague accredited adoption agencies reporting IRS Form 990 in 2016, the figure is $404 Million.
According to the most recent publically available 990 for Hague accredited agencies, the average gross revenue from all sources is $3,520,057. The median figure is $809,587. The range is from $28,000 to $115 Million. For this study, 114 agencies were included. Some agencies were excluded if they do not provide international adoption services. If adoption does not appear as a list of services the agency provides, is not in the mission statement, and is not listed as a category on GuideStar, it was not included. Some agencies act under the umbrella of a church, and were not included since the 990 is not publically available. Keep in mind that much of the revenue for some agencies is from domestic and foster adoption, so this figure over-reports the revenue for international adoption.

Net Profit
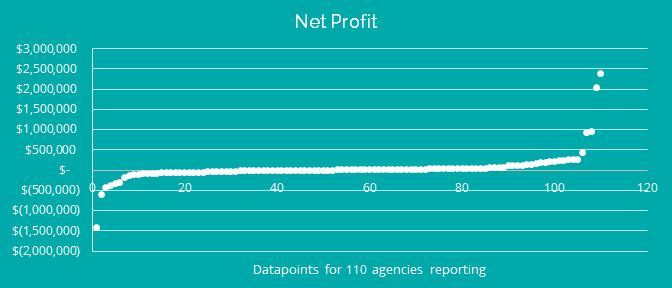
The median net profit for Hague accredited agencies is $6,490. The average net profit is $68,693. This figure is from 110 agencies with records available, and is the average of their two most recent years. Net profit fluctuates more than revenue and expenses, so a two-year average was used for this figure. Additionally, we must note that 47 out of 110 agencies showed an average net loss for the last two years. That means that 43% of Hague accredited adoption agencies have lost money, on average, for the last two years. The range is from -$1.4 Million loss to +$2.4 Million.

Net Assets
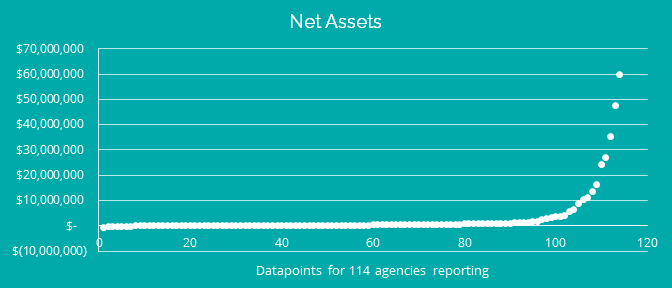
The median net assets of Hague accredited agencies is $314,847. The average figure is $2.9 Million. Twelve agencies (10%) have a negative net worth according to their most recent form 990. The range of net assets (including buildings, vehicles, money held in trust for clients, investments, and cash) is from -$589,000 (debt) to +$59 Million.

Executive Compensation
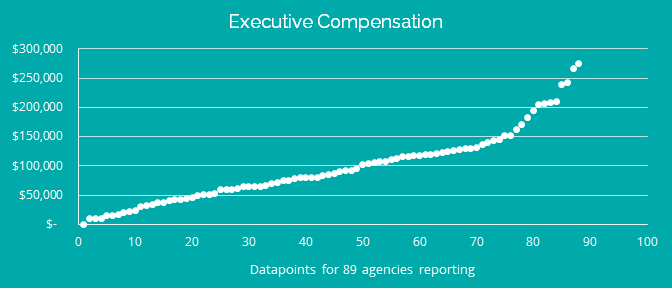
Agencies are not required to report compensation of executive directors unless it is over $100,000, however, many agencies do. Eighty-nine agencies reported ED compensation on their form 990. The average figure is $96,662 with a median of $84,837. The range is from zero to $275,599.

Average Employee Wages
Agencies may report the number of employees on line 5 and the value of compensation on line 15 of form 990. If we divide these two figures, we can determine that the average salary of employees (combined full-time and part-time) including Executive compensation is $35,492.
Profit Margin
The median profit margin (calculated by average net profit over the last two years divided by gross revenue) among Hague accredited agencies is 0.66%! The average profit margin is 1.25%. That means for every million dollars collected, agencies on average only make a profit of $12,500.
How is the Money Spent?
To answer this question we examined the Form 990 of the ten largest adoption agencies, representing more than half the revenue in the entire field.
Only 4% of the revenue is spent on fundraising. Charity-tracking experts generally give an A+ to non-profits who spend less than 15% on fundraising.
Management and general expenses make up 11% of the expenditures for adoption agencies. These expenses include compensation, benefits, office expenses, and travel for officers or directors.
Program expenses account for 82% of the expenditures of these adoption agencies. These expenses include compensation, benefits, rent, and travel for employees who provide direct adoptions services, as well as pass-through costs paid by agencies to other providers. Personnel costs account for 52% of the total revenue of adoption agencies.
Conclusion
There is not a single adoption agency that stands out in this study as having an inappropriately high net revenue or net assets. On the contrary, the most significant finding is that the field contains several financially unviable agencies, and that the practice of intercountry adoption is not a profitable venture – it’s truly non-profit.
Despite the fact that intercountry adoption is generally not profitable, some agencies have been able to remain viable because they have a diversity of programs (foster care, domestic adoption, etc.). Other agencies shave a large endowment upon which they can sustain losses by deriving investment income.
Healthy organizations have net profits and net assets. Adoptive families should be attracted toward, rather than repelled by, agencies with healthy net revenue and assets. This indicates that the agency will have longevity and will be able to serve them for years to come, despite changes in the field. Adoptive families should consider the agency’s GuideStar profile and Form 990 as part of their decision to adopt with a certain agency.


