Foster Care and Adoption Statistics – AFCARS Annual Update
Earlier today, the Administration for Children and Families released their annual report on U.S. Foster Care and Adoption statistics. You can view the full AFCARS report here. We provide a detailed breakdown below, but in short, the report shows that children are spending too long in foster care and too long awaiting adoption.
The AFCARS report provides adoption and foster care data each fiscal year. The newest report shows data from fiscal year 2022 (Oct. 1, 2021 - Sept. 30, 2022). While this is the most current federal data available, it is important to note this data is from over one year ago.
In general, FY 2022 continues the down trending we have seen since FY 2018 and FY 2019, for many significant factors such as the number of children entering foster care, the number of children exiting foster care, the number of children waiting to be adopted, and the number of children who were adopted.
It is important to remember that an increase or decrease in the number of children entering foster care should not be our measure of success.
Rather, our goal should be to reduce child maltreatment rates, reduce time spent outside permanent family care, and reduce timeframes and numbers of children awaiting adoption.
FY 2022 had the fewest number of adoptions from foster care since FY 2015.
For the fourth year in a row, there was a decrease in the number of children in foster care, with 368,530 in care. The number of children in foster care awaiting adoption also decreased, to 108,877, the lowest point since FY 2014. The total number of exits from foster care was 201,372, constituting the fewest number of exits from foster care since AFCARS reporting began.
The number of children adopted from foster care in FY 2022 was 53,665. This was only a 1% decrease from the year prior, but over an 18% decrease from FY 2019, marking FY 2022 as having the fewest number of adoptions from foster care since FY 2015.
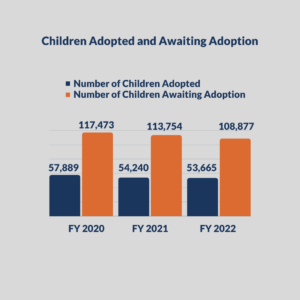
Children Adopted and Waiting to be Adopted
“Children awaiting adoption”, also known as “children available for adoption”, describes children whose parental rights have been terminated and/or children with a case plan goal of adoption. In FY 2022 30% of all children in foster care were awaiting adoption. This data also shows that for every child adopted from foster care, two children remained in care who were awaiting adoption. While the number of children adopted decreased slightly in FY 2022, when compared to the total number of children in foster care, the percentage of children awaiting adoption (30%) and the percentage of children adopted (15%) remained almost exactly the same as the prior year.
Additionally, we want to highlight children who are living in pre-adoptive homes, since this often indicates that a child is closer to achieving permanency. Over 85% of children available for adoption were not living in a pre-adoptive home, meaning that many of these children may still be many steps away from achieving permanency.
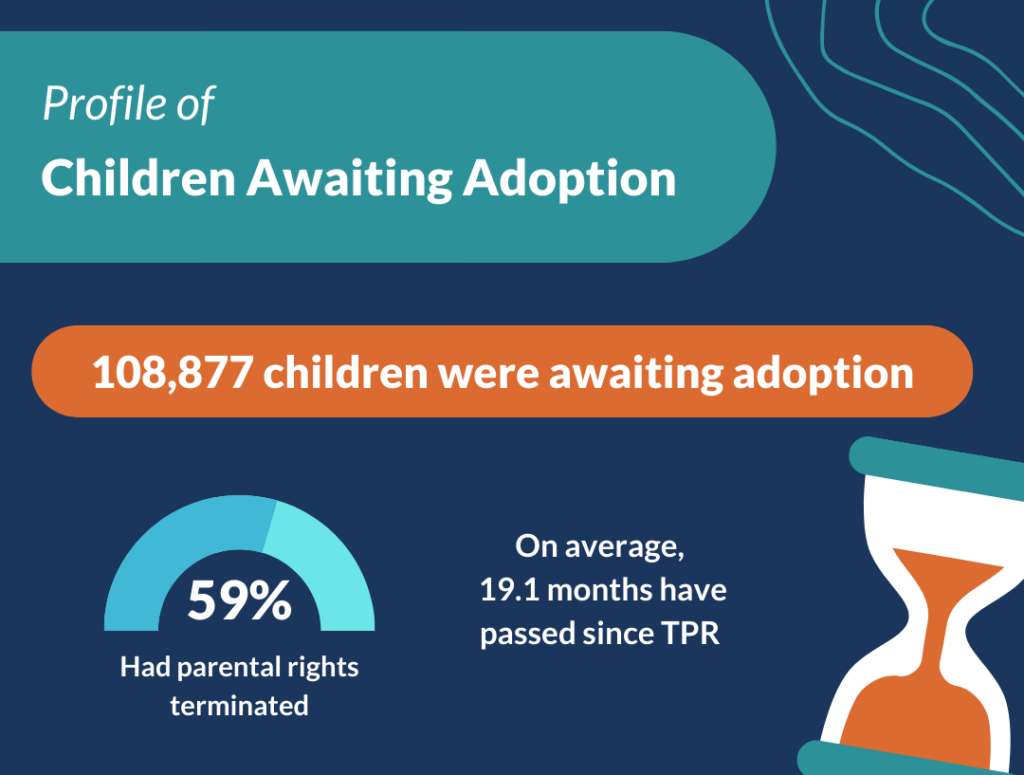
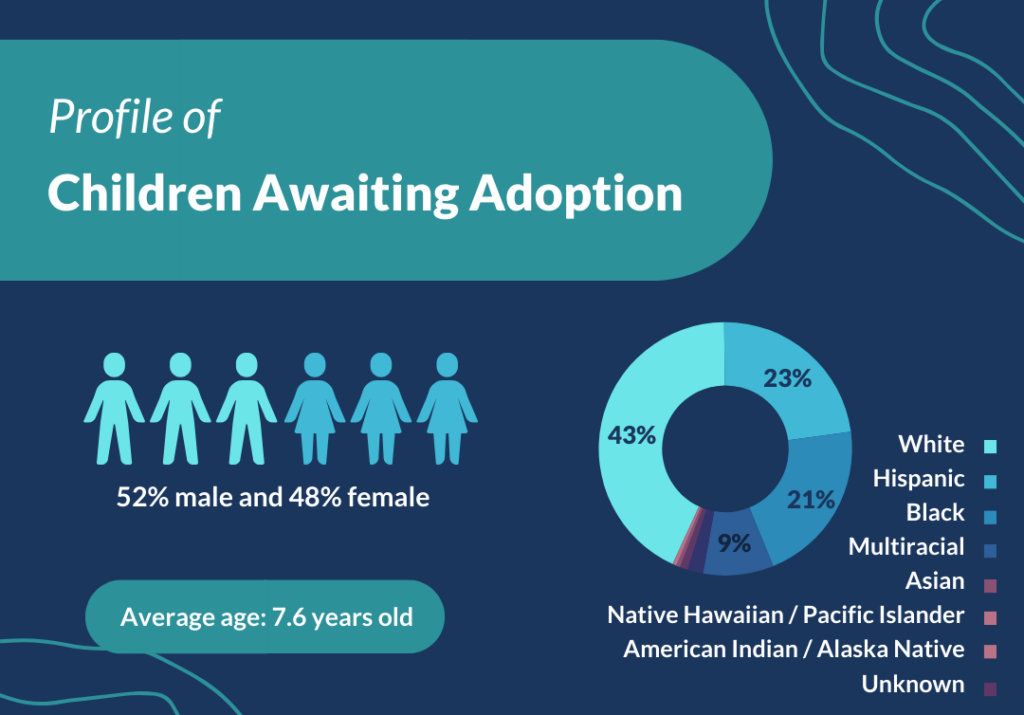
Profile of Children Awaiting Adoption
- There were 108,877 children awaiting adoption in FY 2022
- 37% were age four years or younger, 41% were age 5-12 and 23% were age 13-17. The median age was 7.0 years and the mean age 7.6 years.
- 52% were male, and 48% were female, similar to the percentage of those in foster care.
- 43% were White, 23% were Hispanic, 21% were Black, 9% were two or more races, 2% were American Indian or Alaska Native, 2% were unknown, 0% were Asian, and 0% were Native Hawaiian or other Pacific Islander. For children of each race, the percentage of children awaiting adoption was similar to the percentage of those in foster care.
- 59% whose parental right were terminated, as of the last day of FY 2022. The median time since TPR was 10.0 months and the mean was 19.1 months.
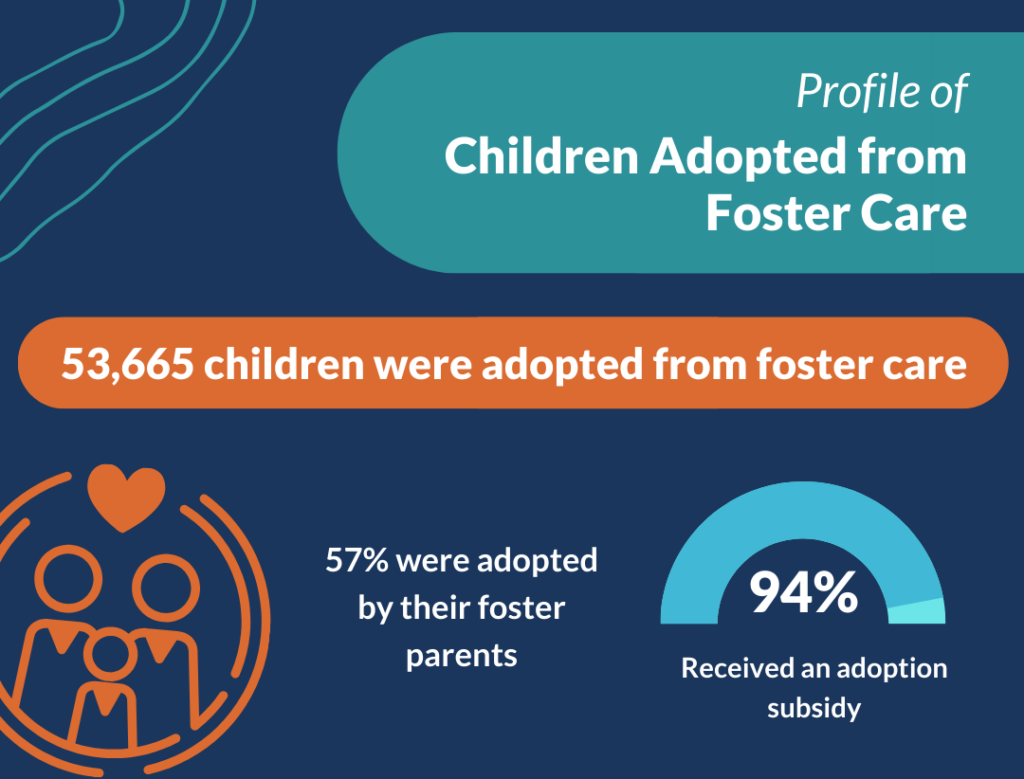
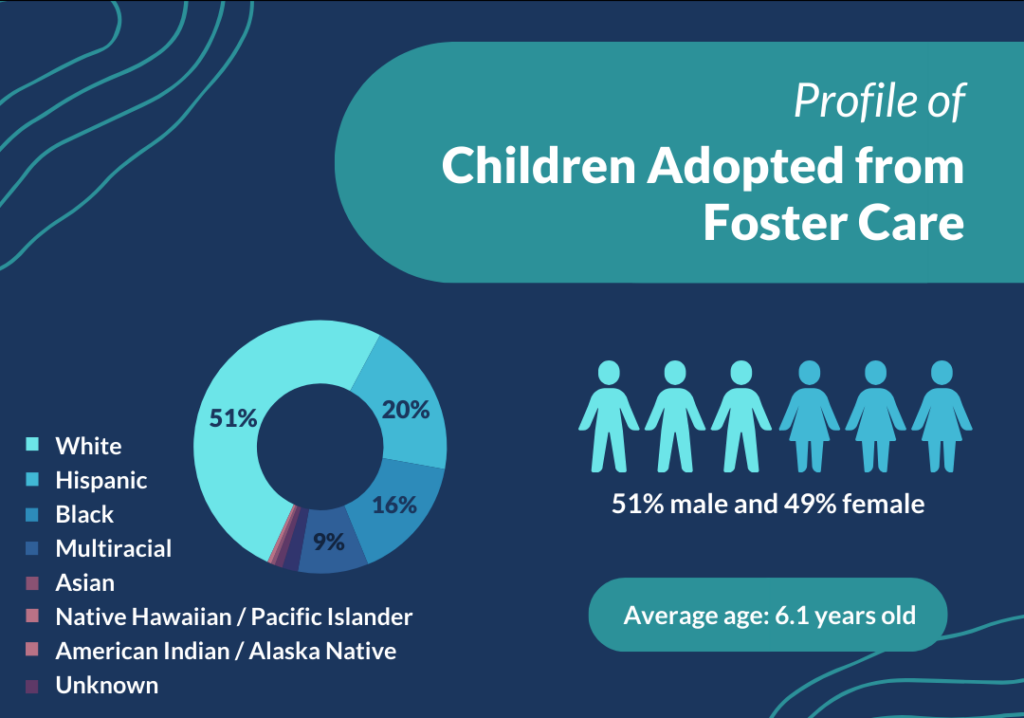
Profile of Children Adopted from Foster Care
- There were 53,665 children adopted from foster care in FY 2022
- 48% were age four years or younger, 40% were age 5-12 and 12% were age 13-17. The median age was 5.0 years and the mean age 6.1 years.
- 51% were male, and 49% were female, matching the percentage of those in foster care.
- 51% were White, 20% were Hispanic, 16% were Black, 9% were two or more races, 2% were American Indian or Alaska Native, 1% were unknown, 0% were Asian, and 0% were Native Hawaiian or other Pacific Islander. Notably, the percentage of white children adopted from foster care (51%) was higher than the percentage of those in foster care (43%). Additionally, the percentage of black children adopted from foster care (16%) was lower than the percentage of those in foster care (23%).
- The majority (57%) were adopted by their foster parents.
- Consistent with previous years, 94% of those adopted from foster care receive an adoption subsidy.
Exits from Foster Care
Of the 201,372 youth that exited foster care in FY 2022, they spent an average of nearly two years (22.6 months) in foster care.
Just under half (46%) of children who exited foster care were reunified with their families, while 27% were adopted and 11% exited into guardianship placements.
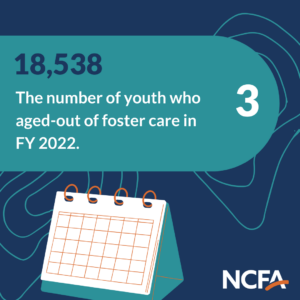
The FY 2022 AFCARS report also shows 18,538 youth emancipated from foster care this year. Each year this number reminds us of the failures of our child welfare system to help achieve permanency for our youth. The impacts of aging out of foster care are worse than all other exit types, resulting in poor long-term well-being outcomes for youth and expensive ongoing costs to states.
Time in Care
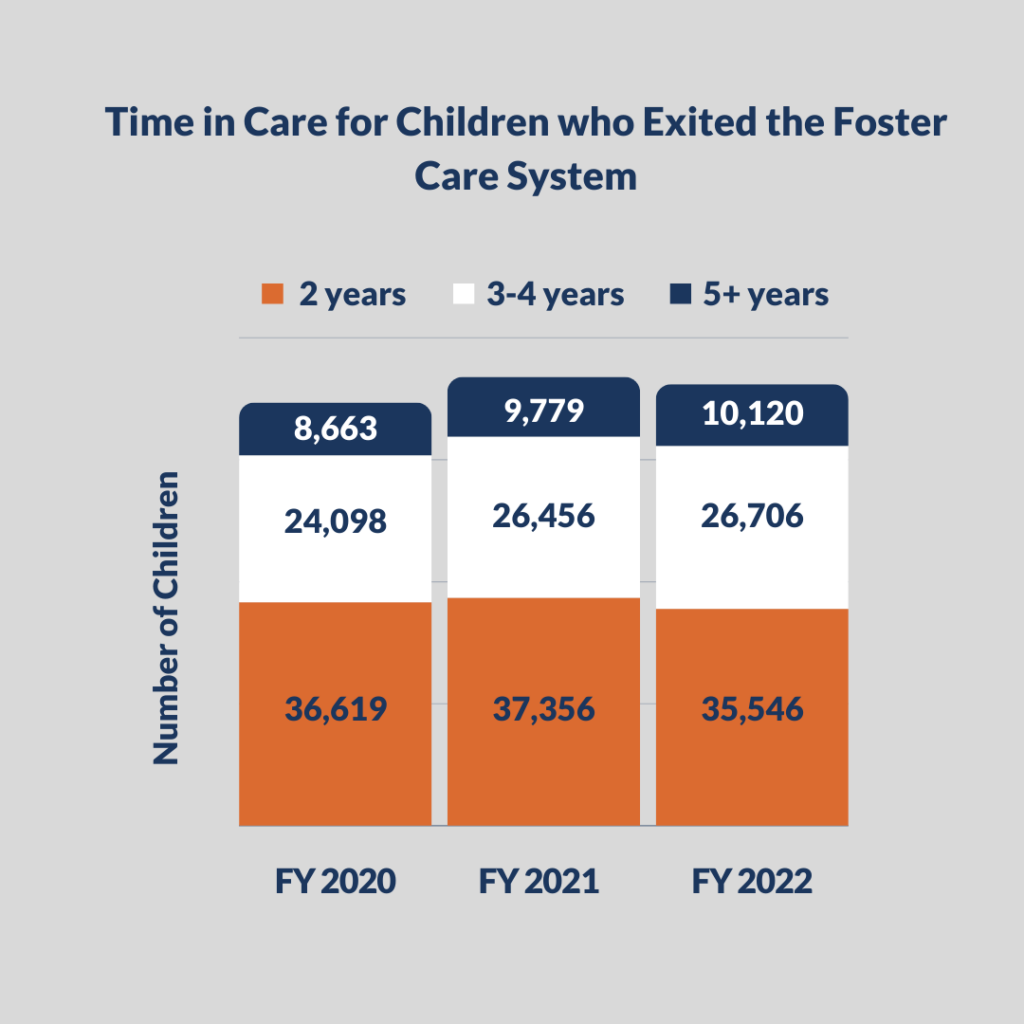
This report showed that more than a third of children who exited foster care in FY 2022 spent more than two years in foster care – amounting to 72,372 children and youth, with over 26,000 of those kids having spent three to four years in care and over 10,000 children having spent five or more years in care.
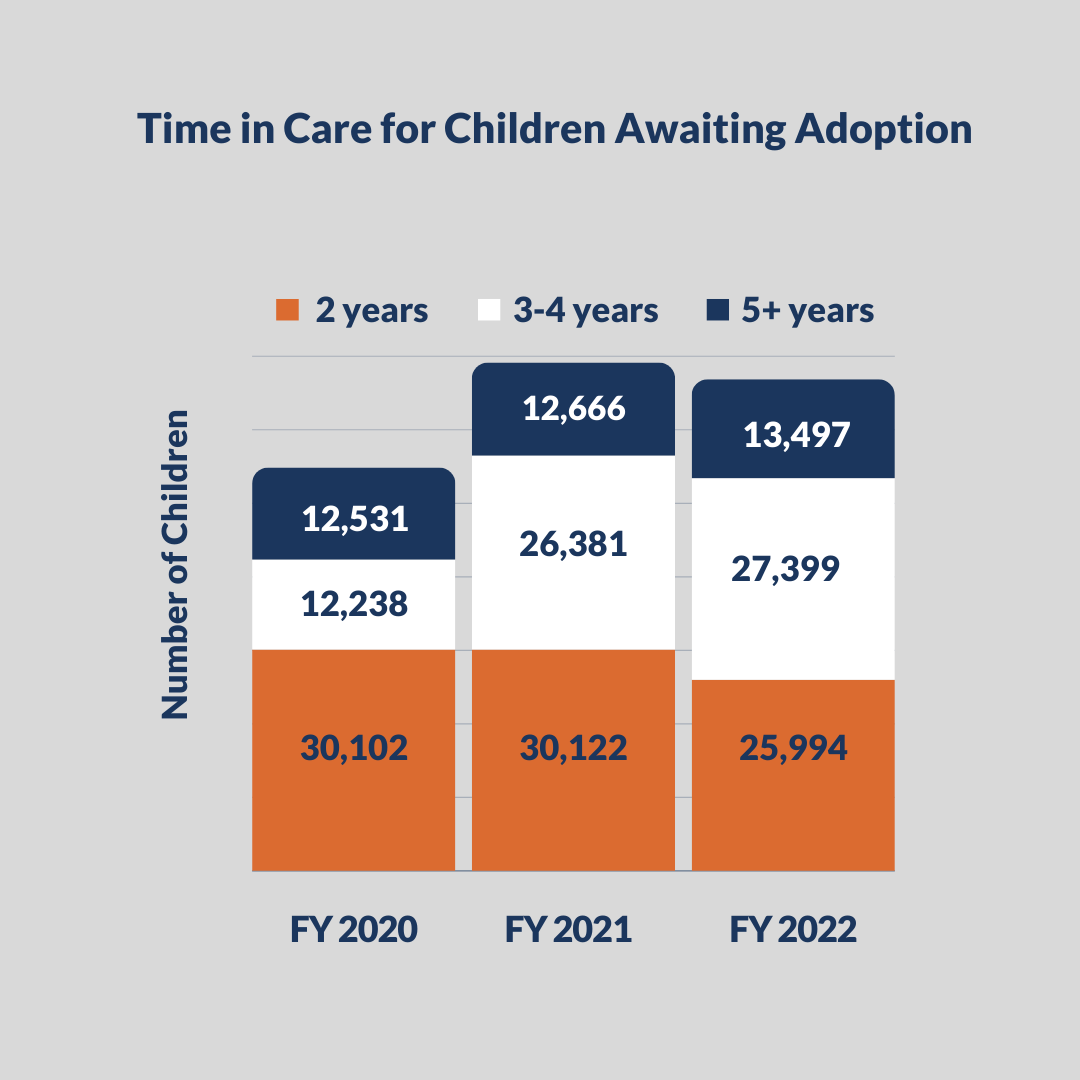
Additionally, 60% of children awaiting adoption have spent more than two years in foster care, with over 27,000 children having spent three to four years in foster care and over 13,000 children having spent five or more years in care.
These numbers offer a tragic reminder that our system is not meeting the goal of achieving permanency for children in foster care within reasonable timeframes. It is important to compare these reported exit timeframes to the 12-month permanency timeframe guidelines established by the Adoption and Safe Families Act (ASFA). Additionally, it is important to consider the impacts on children and youth who languish in care without achieving permanency and stability.
Conclusion
This report shows that over 108,000 children and youth are available for adoption and are still without a permanent, nurturing family to help them thrive during their most formative years. It also demonstrates that states are not following federally-mandated timeframes to move children to a permanent family.
NCFA applauds all the caseworkers and families who together supported over 53,000 children in finding homes in FY 2022. If you are considering adoption from foster care, you can learn more about the process here.
